Review the latest Weekly Headings by CIO Larry Adam.
Key takeaways
Financial markets are watching for signs of potential de-escalation in the US–Iran conflict. While senior military officials on both sides have signaled that the campaign may intensify in the near term, keeping headline risks elevated, we outline below why we believe the conflict is likely to be short-lived, and what that could mean for the economy, the Federal Reserve and financial markets in the weeks ahead.
Market impact from geopolitical events
Over the past three decades, global markets have navigated a wide range of geopolitical shocks, from terrorist attacks to armed conflicts, each accompanied by tragic human loss. While these events often dominate headlines, their longer‑term impact on financial markets has typically been limited.
Markets tend to view such shocks as temporary, and when conflicts remain contained, they seldom inflict lasting economic damage. Short‑term market pullbacks do happen, but history shows they are usually brief. In fact, since the 1990s, the S&P 500 has been higher on average one, three, six and twelve months after geopolitical events. That resilience reflects a core reality: Over time, equity markets are driven by fundamentals, which are earnings, economic growth, and interest rates. As long as those fundamentals remain supportive, markets have shown an ability to recalibrate and move forward.
The US-Iran conflict
With the US-Iran conflict still in its early stages, markets are weighing whether Operation Epic Fury could escalate into a prolonged confrontation or remain more contained. While the situation is still unfolding, our view is that this conflict is likely to be measured in weeks, not months.
Our base case points to a three‑ to four‑week timeframe, supported by several factors. First, this is a midterm election year, and an extended military engagement would carry meaningful political risks for the administration. Second, concerns around limited munitions stockpiles in the region, even with greater capacity elsewhere, reduce the likelihood of a sustained campaign. Finally, the administration has left its end goal deliberately open ended, preserving the flexibility to declare “mission accomplished” once core objectives are achieved.
Taken together, these dynamics suggest the conflict is more likely to remain a headline risk, capable of driving short‑term market volatility, rather than a lasting economic or portfolio risk.
Most important variable to watch: oil
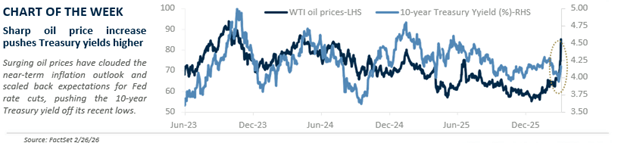
Oil prices have surged from the mid-$50s in the weeks leading up to the conflict to now topping $88 per barrel. The key question for markets is whether this conflict leads to a lasting disruption in oil and natural gas flows from the Persian Gulf, which supplies nearly 20% of the world’s energy.
While the situation is spreading - more than 10 countries in the Middle East are now affected - we expect the conflict to be short-lived. Once a clear off ramp emerges, the geopolitical risk premium embedded in oil prices should fade quickly. At that point, prices are likely to refocus on fundamentals: A market that remains structurally oversupplied, with 2026 on track to mark the sixth straight year of excess supply. That’s why we’ve maintained our $55 to $60 per barrel year‑end target. Importantly, China, one of the largest buyers of Iranian oil, has strong incentives to discourage prolonged disruptions and impediments to transit through the Strait of Hormuz, the main artery for global crude flows.
How does the war impact our views
While market volatility has picked up, we’re not inclined to change our views at this stage. That said, if the conflict extends beyond our expected three‑ to four‑week timeframe, we would reassess our 2026 forecasts and targets.
All expressions of opinion reflect the judgment of the author(s) and the Investment Strategy Committee and are subject to change. This information should not be construed as a recommendation. The foregoing content is subject to change at any time without notice. Content provided herein is for informational purposes only. There is no guarantee that these statements, opinions or forecasts provided herein will prove to be correct. Past performance is not a guarantee of future results. Indices and peer groups are not available for direct investment. Any investor who attempts to mimic the performance of an index or peer group would incur fees and expenses that would reduce returns. No investment strategy can guarantee success.
Economic and market conditions are subject to change. Investing involves risks including the possible loss of capital.
The information has been obtained from sources considered to be reliable, but we do not guarantee that the foregoing material is accurate or complete. Diversification and asset allocation do not ensure a profit or protect against a loss.
The S&P 500 Total Return Index: The index is widely regarded as the best single gauge of large-cap U.S. equities. There is over USD 7.8 trillion benchmarked to the index, with index assets comprising approximately USD 2.2 trillion of this total. The index includes 500 leading companies and captures approximately 80% coverage of available market capitalization.
Sector investments are companies focused on a specific economic sector and are presented here for illustrative purposes only. Sectors, including technology, are subject to varying levels of competition, economic sensitivity, and political and regulatory risks. Investing in any individual sector involves limited diversification.